


History: Blood Pressure Measurement Background
Blood pressure is one of the first objective measures used to evaluate risk in life insurance applicants. It is a very commonly used determinant of eligibility for Preferred underwriting classes in so-called “knock-out” systems. Because of this, paramedical examiners are often instructed to collect repeated measurements during their examination of insurance applicants. Insurers will then often average the values obtained before applying their internal underwriting criteria. It is frequently asked if these repeated measurements are necessary in the circumstance where the first measurement is normal — after all, it would be a shorter exam and a better customer experience if it did not have to be repeated.
Blood pressure was first identified as a clinical entity in the 1800s. The first measurement devices were pressure transducers which had to be surgically introduced into an artery. Naturally, very few people had their blood pressure measured this way. Despite this difficulty, an Irish physician, Frederick Akbar Mohamed, discovered many of the clinical manifestations of high blood pressure including effects on the kidney, heart and brain¹. It was not until the late 1800s that an effective, non-invasive sphygmomanometer was developed, and it was not until the mid-twentieth century that blood pressure cuffs became widespread.
At first, elevated blood pressure was assumed to be an immutable property which could not be changed. President Franklin Delano Roosevelt was given a clean bill of health despite a blood pressure of 220/120. He subsequently died of a hemorrhagic stroke. This brought attention to hypertension as a clinical issue and the subsequent National Heart Act funded multiple ongoing studies including the Framingham Heart Study. Soon after, these studies quantified the association between blood pressure, stroke, renal disease and heart attack. Importantly, it was also demonstrated that treatment could reduce blood pressure and ameliorate the elevated risk².
The specific level of blood pressure at which the risk justifies treatment has been a bone of scientific contention for decades. At first, it was only diastolic blood pressure which was considered important, and only treated if it exceeded 120 mmHg. Since blood pressure is strongly correlated with age, it was recommended that treatment only be considered when the systolic blood pressure was higher than 100 mmHg plus the age of the individual. The SHEP study (Systolic Hypertension in the Elderly Project) determined that systolic hypertension above 140 mmHg was also associated with increased risks in the elderly, and so the 100+Age rule disappeared. In the most recent American Heart Association clinical guidelines, hypertension begins at a systolic pressure of 130 mmHg or a diastolic of 80 mmHg. However, drug treatment is not routinely recommended at these levels — rather, that decision is based on risk. Treatment is recommended for those with diabetes, heart disease or other cardiovascular and renal risk factors. When the level gets to 140 systolic or 90 diastolic, drug treatment is recommended³.
Obviously, with such important clinical decisions relying on the level of blood pressure, its accurate measurement is crucial. The AHA recommends measuring blood pressure on a bare arm, in the seated position with the arm supported at heart level. The cuff should be appropriately sized such that the bladder of the cuff encompasses 80% of the arm’s circumference. Measurement should be done after 5 minutes of rest and not immediately after smoking tobacco. Measurement is recommended in each arm, with the average used as the final blood pressure reading⁴. Since this procedure is time consuming, it is seldom used in clinical practice — much less so in home-based examinations performed by paramedical examiners.
Facts: Blood Pressure Data & Trends
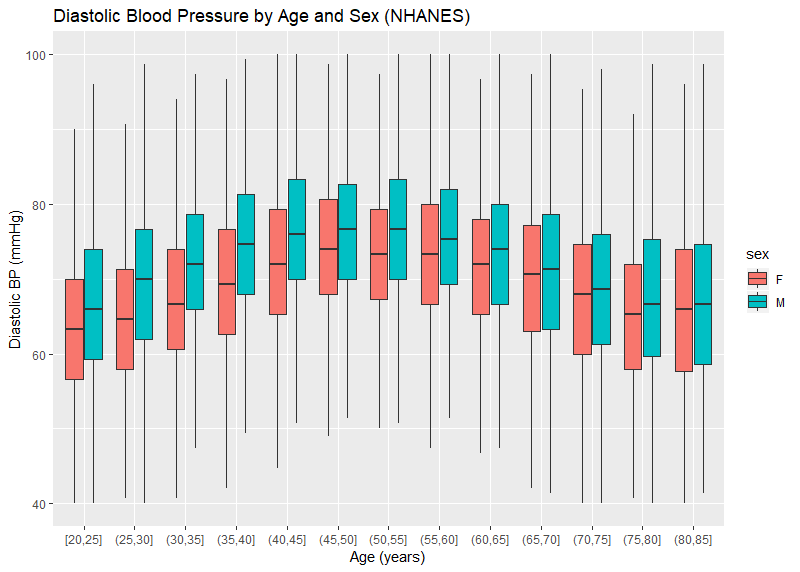
CRL has blood pressure readings on over 9.3 million insurance applicants — each of whom have at least 2 measurements. The distribution of the average systolic and diastolic blood pressure by age and sex are pictured in Figures 1 and 2. Systolic BP is noted to increase over the range of ages, particularly for women. Male systolic BPs tend to be higher than similarly aged females. The trend for diastolic BP is similar though less pronounced. It is also noted that, even at older ages, a blood pressure of 140 mmHg is nearly 10 points higher than the 75th percentile (the top of the colored boxes). This is different than the general American population where the 75th percentile is over 140 mmHg for men over age 60. Figures 3 and 4 use published data from NHANES — the National Health and Nutrition Examination Survey, a cross-sectional study of Americans. The NHANES data also show a downward trend of diastolic blood pressures at older age, which is physiologically consistent with the loss of arterial elasticity over time. There is no clear reason why insurance blood pressures are lower, but it may be due to a healthier population applying for insurance, or possibly examiner error.
Figure 1:
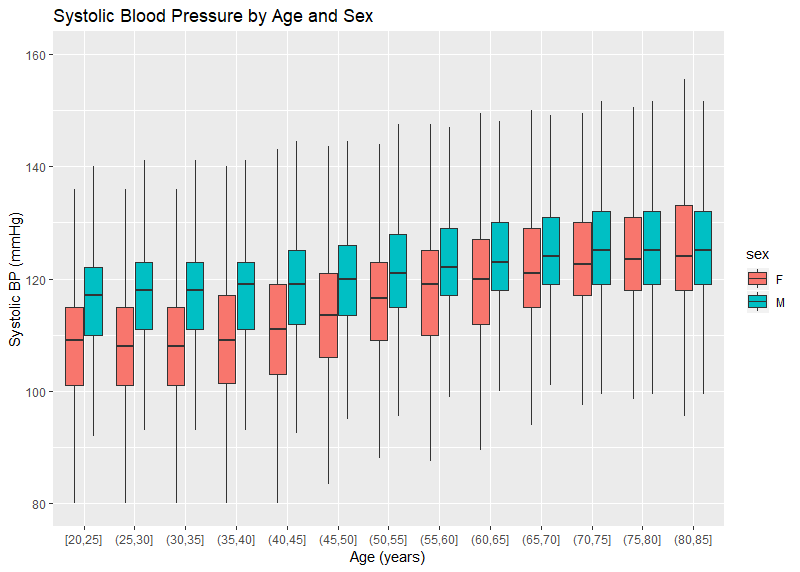
Figure 2:
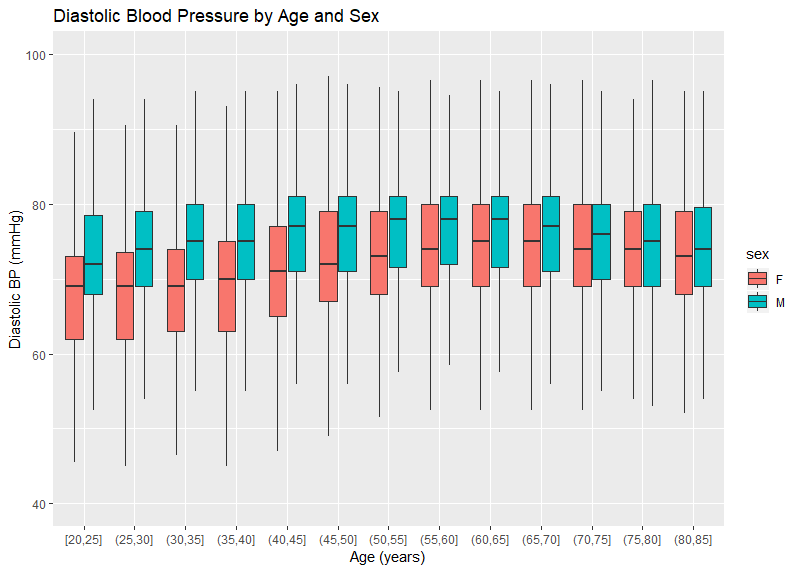
Figure 3:
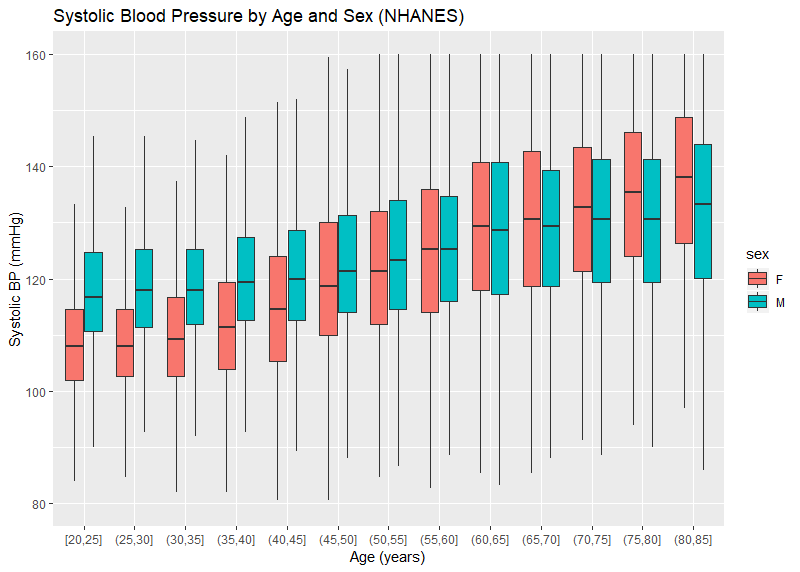
Figure 4:
In order to determine if more than one blood pressure reading is valuable, various threshold were evaluated. For each threshold, we determined what percentage of cases would cross that threshold when the second reading was taken. For instance, if an insurer has a BP threshold of 130/80, then it would be useful to know what proportion of cases would have a first reading below that threshold, but an average of 2 readings above that threshold. This would represent the proportion of possible ‘misses’ if only one BP were ever done. Additionally, it may be interesting to see what proportion would cross the threshold from high to low based on a second measurement. Adding these two complementary statistics together yields an overall ‘error rate’. Table 1 shows the error rates using common life insurance thresholds. Note that the error rate rises as the threshold gets lower.
Table 1:
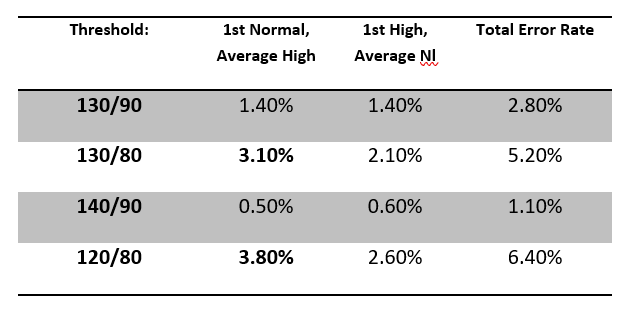
The paramedical examination of blood pressure can yield values on initial measurement that are lower than typical insurance thresholds, but upon second measurement yield averages above those thresholds. The rate of occurrence of this phenomenon is higher with lower blood pressure thresholds. It would be advisable then, for insurers to have examiners collect at least 2 measurements of blood pressure during examinations, unless the insurer has unusually high blood pressure thresholds to qualify for the best available class.
It should also be noted that blood pressures collected during insurance examinations appear to be substantially lower that a similarly aged general population.
+++
References
[1] Booth J. A Short History of Blood Pressure Measurement, Proc. Roy. Soc. Med. 1977 (70); 793–799.
[2] Saklayen MG, Deshpande NV. Timeline of History of Hypertension Treatment, Front. in Cardiovasc. Med. 2016(3:3).
[3] Whelton PK, et al. 2017 ACC/AHA/AAPA/ABC/ACPM/AGS/APhA/ASH/ASPC/NMA/PCNA Guideline for the Prevention, Detection, Evaluation, and Management of High Blood Pressure in Adults: A report of the ACC/AHA Task Force on Clinical Practice Guidelines. Hypertension (2017).
[4] Pickering TG, et al. AHA Scientific Statement. Recommendations for Blood Pressure Measurement in Humans and Experimental Animals. Hypertension. 2005;45:142–161.
About the Author
Dr. Steven J. Rigatti is a consulting medical director with Clinical Reference Laboratory, with 12 years’ experience in the life insurance industry. He is the current chair of the Mortality Committee of the American Academy of Life Insurance Medicine.